Exercise: BIM Progress Monitoring
Progress Monitoring allows you to track the progress of a construction project by comparing the BIM model to the scan data.
Open the file
Open the file ProgressMonitoring.3dr. It contains two point clouds of a construction site as well as the corresponding BIM model of the beams waiting to be built. The clouds have been scanned at intervals of one week.
Compute progress
Each sub-element of the BIM file will be individually compared to the point cloud; so it is recommended to remove the unnecessary elements such as screws or ground for example. This will also reduce the computation time.
Select the cloud Week1 and the BIM Model structure and go to Progress Monitoring.
The first step of this workflow, Analyze, will compute the % of completion for each sub-element. Here you can adjust three parameters:
The first bar of the Coverage slider (red to yellow) sets the coverage threshold for considering the sub-element as "Incomplete" and no longer as "Not installed". Leave the default value 5%.
The second bar of the Coverage slider (yellow to green) sets the coverage threshold for considering the sub-element as "Installed". Leave the default value 35%.
The Tolerance is necessary to filter out points, by distance, which don't match any sub-element. This parameter is also suitable to take into account the point cloud accuracy. Here, you can set this parameter to 0.05m.
The Resolution is necessary to sample BIM objects. Here, you can set 25cm.
Click on Compute: the inspection is launched. The sub-elements are classified in four statuses: Installed, Incomplete, Not installed and No data (green, orange, red and grey respectively).
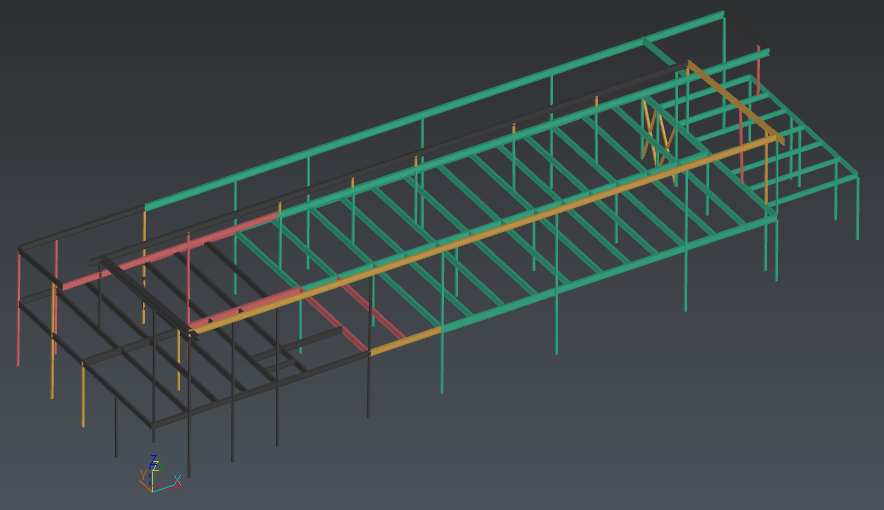 Week 1 progress
Pie chart
You can hover your cursor over the portions of the pie chart to see the ratio of objects classified in each status.
You can see that most of the beams are marked as installed. Click on Next to go to the Check step of the workflow.
Check the results
Now, you can find on the left a tree containing all the sub-elements. By default, each node content is sorted by growing coverage.
On the right, two views: the left one displays the overall Progress View, and the right view shows specially the selected sub-element.
Click on a sub-element, whether in the tree or in the left view: the right view displays the element in the inspection mode and its matching points.
If you think the thresholds were inappropriate, you can come back to the Analyze step with the Previous button and Reset the analysis to compute a new one. If necessary, you can modify the automatic classification: select the sub-element you want to edit and press SPACE. Check up the notifier to know the key shortcuts.
Finally, you can click on Next to go to the final step of the workflow: Export.
Export a report
This step will allow you to generate the reporting data and optionally to export a BCF file containing issues to be imported in your BIM platform and software.
Click Update Report View to define the scene view that will be included in the report and in the BCF.
If you want to export a BCF, assign the issues to someone and choose between exporting only the Summary or Summary + detailed issues:
The first one will only export one issue with synthetic data of the analysis.
The second will create a BCF with an issue per analyzed sub-element. You can choose not to export specific statuses to only keep track of what you're interested in.
You can now Exit the workflow and go to the report editor so as to generate the PDF report. Note you can edit the analysis by clicking on the Play icon in the explorer tree next to the Progress Monitoring folder.
A week later
It is time to check again the progress. Select the BIM object and the second cloud, called Week2 and repeat the analysis with the same parameters.
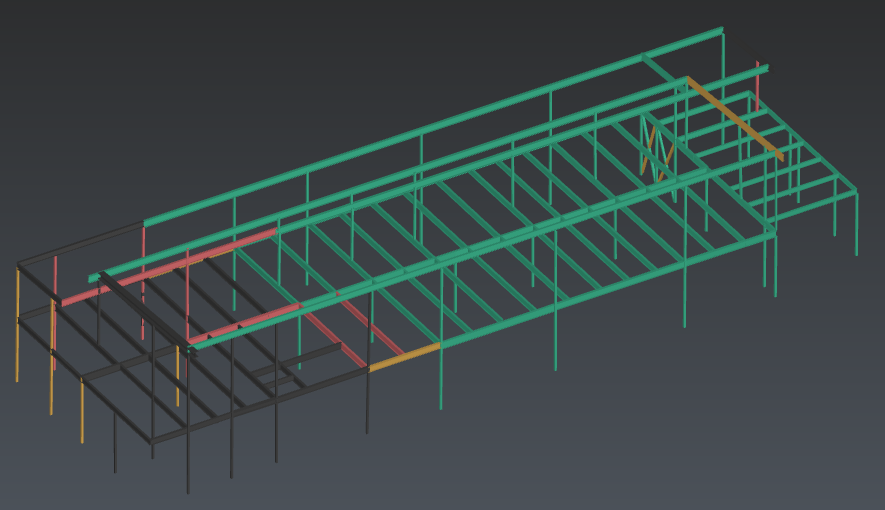 Week 2 progress