Exercise: Perform a FF/FL analysis
Open the file FFFL.3dr. It contains one cloud of a construction site.
Select it, launch FF/FL Analysis and follow the 5 workflow steps with the advices below.
Extract floor
The process combines:
a planar extraction according to a seed point and a tolerance: click a point on the floor and adjust the tolerance (2inches by default).
a limit box restriction. The limit box is automatically displayed after giving a seed point. It is predefined according to the cloud bounding box and the previously activated limit box if any.
You may Reduce the box to keep only the area of interest. If working with CloudWorx data, define the amount of points to keep for the analysis, thus speeding up the computations.
Compute results and click Next.
Define test surface and sections
Firstly, define the specified values:
Specified Overall Flatness: 20
Minimum Local Flatness: 15
Specified Overall Levelness: 20
Minimum Local Levelness: 15
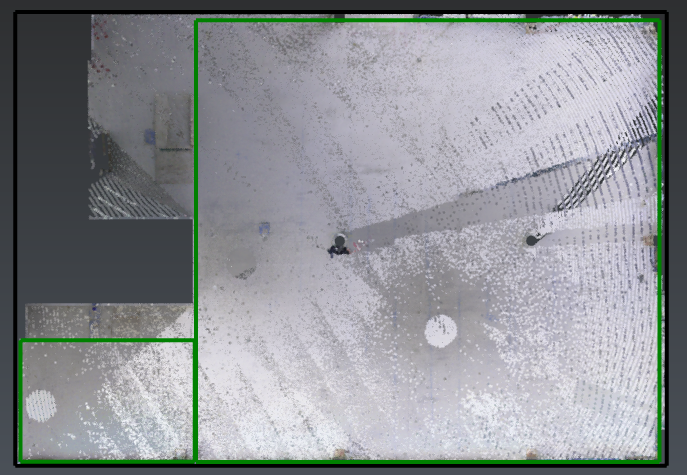
Then define the area of interest, called test surface, in Free mode (in opposition to the Aligned along UCS mode). See the black rectangle in the image below.
Go to the next step and define two test sections like the image below.
 Test section layout
Note the test sections (and the test surface) have to comply with minimal dimensions according to ASTM E1155 standard.
Finally, click Next.
Define and adjust sample lines
Sample lines have to comply with the standards of ASTM E1155. An automatic proposal is made, you may edit it thanks to two patterns and a custom amount of lines.
It is also possible to move the sample lines and to shorten them when using the 45 degrees pattern. However, you may change your mind: you still can return to the previous step and rearrange the test sections to better cover the area.
List of warnings:
Test section error: the default pattern can't be applied automatically.
Test section warning: the sample lines are not enough or enough long to compute FL. Add sample lines or choose an alternative pattern.
Red sample line: some measurements along the sample line can't be made because of holes or sparse data. Move the corresponding lines. This color can also mean the sample line crosses the test section border.
Orange sample line: when moving a sample line, the new position has to be farther than 4ft from other parallel sampling lines. This color can also mean a too short line for FF computation.
Sample line distribution: when moving a sampling line, you have to verify their distribution by your own. They should cover the entire test section.
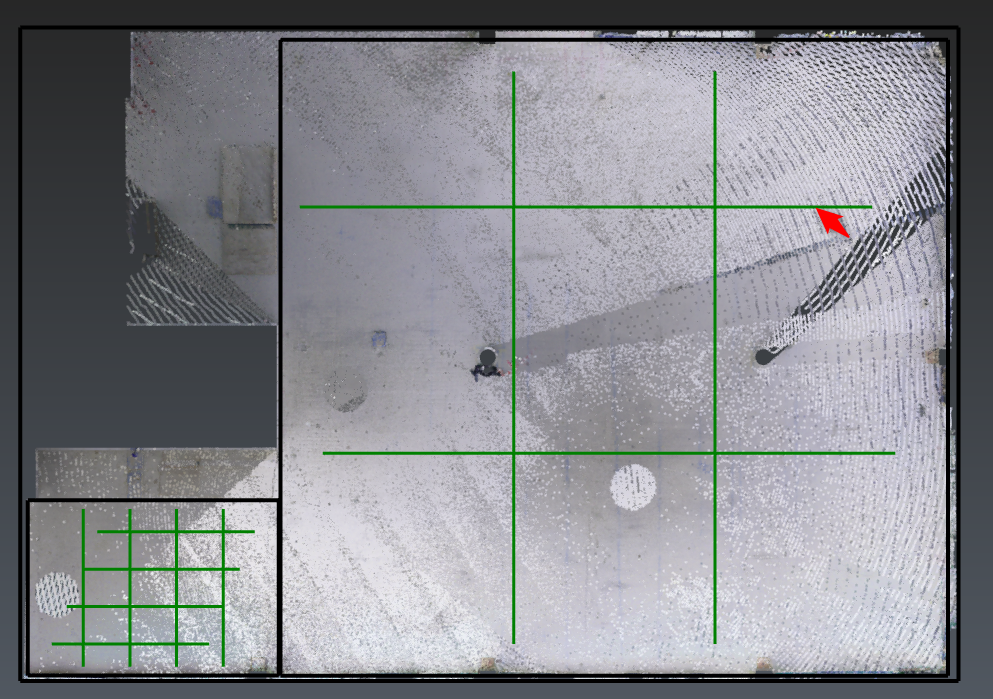
Define your sample lines using one of the following layout below.
 Parallel and perpendicular layout
You will have to add sample lines and to move one because of sparse data.
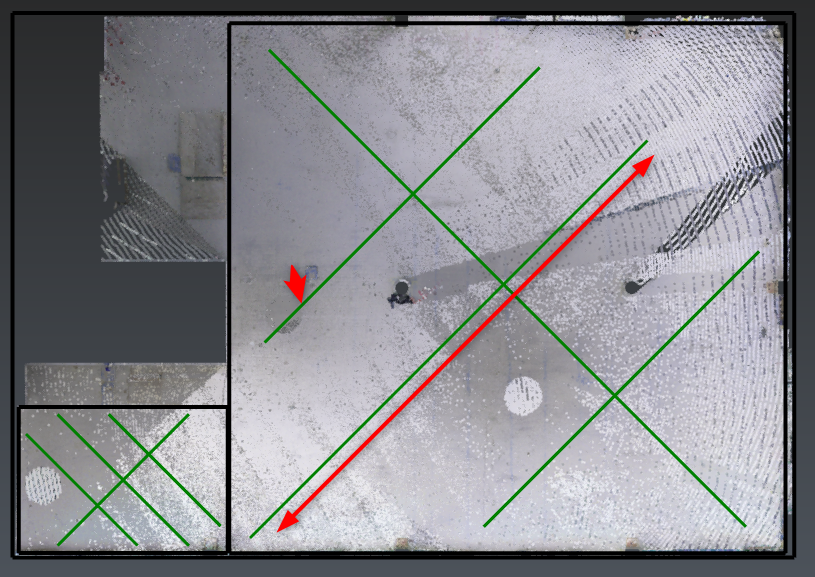
 45 degrees layout
You will have to add sample lines, to shorten one and to move another one (something laid on the floor).
Click Compute and the cloud will be colored according to the level. Then go the last step.
Generate the results and the report
Now you can read the test results and the FF/FL values:
for each sample line,
for each test section,
and for the test surface.
When you select a sample line from the list, you can display its profile.
 Profile
Click Exit button and open the report editor. You can rearrange the template and click To PDF to generate the report. Tables can also be exported To CSV files.