Cloud vs

images/download/attachments/113546906/CmdCompareInspectCloudVSCloud.svg images/download/attachments/113546906/CmdCompareInspectCloudVSMesh.svg images/download/attachments/113546906/CmdCompareInspectCloudVSCAD.svg images/download/attachments/113546906/CmdCompareInspectCloudVSGeometry.svg images/download/attachments/113546906/CmdCompareInspectCloudVSBIM.svg

This command calculates a color map to show the deviations between two objects.

Select the two objects to inspect and launch the command.

  • The first selected object is the reference object.

  • The second selected object is the measured object that will be projected on the reference.

The Cloud here is the measured object for the inspection.

List of reference objects available

  • Cloud

  • Mesh

  • CAD Surface

  • Surfacic Geometry

  • BIM

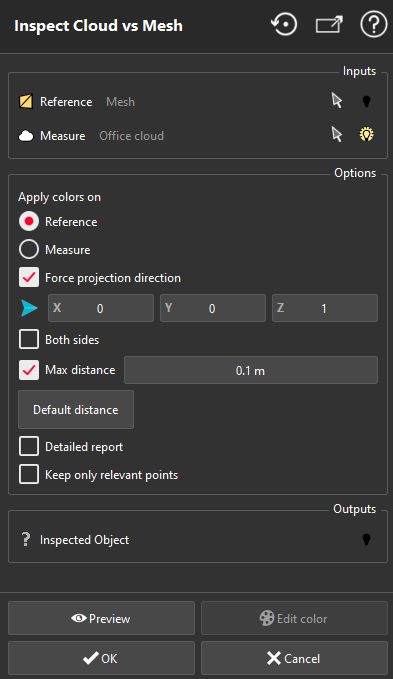
Description of the command

images/download/attachments/113546906/image2019-7-26_17-35-11.png

  1. The dialog box asks which object should be colored. In the case Cloud vs Cloud, you can only colored the measured cloud, refer to vs Cloud.

  2. Force projection direction: If you choose not to force the direction, the software will search the closest point in 3D, else you have to enter a direction for the inspection.

  3. Both sides: Only available if the direction is forced.

  4. Max distance: Enter the threshold distance over which the points are considered as too far away. These points will not be used for the color map. The default value can be computed with the Default distance button.

  5. Detailed report: This option is used to add a list of all inspect points in the report. Only available for Cloud vs Mesh, Cloud vs CAD Surface, Cloud vs Geometry and Cloud vs BIM.

  6. Keep only relevant points: This option allows to ignore points whose projections are on the free edges. This option is not available in the case Cloud vs Cloud, or if the reference object is closed.

  7. Validate the command with OK, or, close the dialog box with Cancel.

Once the color mapping is computed, a special object is created with distance and color information. You can edit the colors by clicking on Edit color. The command Edit Colors is launched.

Create a report

This command automatically creates reporting data images/download/thumbnails/113546262/ReportingDataIcon.png in your document. This object stores your results so as to create a report later.

From the treeview click on the magnifier iconimages/download/thumbnails/113546262/ReportEditorIcon.png to launch the report editor (or launch Report Editor). Then, each object images/download/thumbnails/113546262/ReportingDataIcon.png stands for a chapter which can be added to your report.

Refer to Reporting to learn how to customize your report.