Volume Over/Under
![]()
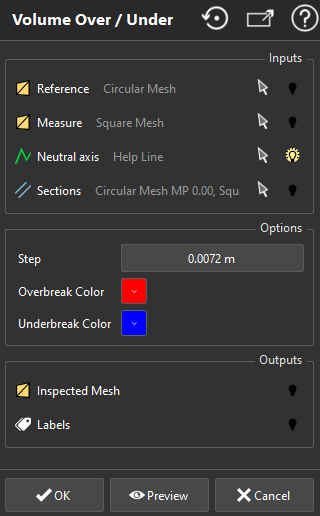
This command computes the overbreak and underbreak volumes on a tunnel. The method used is the interpolation between cross sections. The tunnel is divided into parts corresponding to the number of cross sections selected before launching the command. For each part, subsections are created and surfaces are computed in order to interpolate the volumes.
Select:
the two meshes (for example the theoretical tunnel and the measured tunnel),
the axis
the cross sections previously created on the two meshes with the command Create Profiles along Axis.
Then, launch the command.
Sections should have the same name as their respective tunnel in order to work properly.
For example: If you have a tunnel called "Theoretical tunnel", the Section called "Theoretical tunnel MP 100.00" will be automatically associated to it.
When sections are opened, their surfaces (over/under) cannot be computed. They are replaced by approximate ones which can lead to inaccurate or wrong volumes. To get the best from this command, please fill holes and eliminate double layers of both meshes.
The generated data include the table with intermediary results:
open the Report Editor
add (or export) the Results table that you will fin in the Data panel.
|
|
The two meshes are compared and the resulting mesh is inserted in the 3D scene. A label is created for each slice. It contains the values of the volumes overbreak (Vol +) and underbreak (Vol -) for the corresponding part. |
Create a report
This command automatically creates reporting data ![]() in your document. This object stores your results so as to create a report later.
in your document. This object stores your results so as to create a report later.
From the treeview click on the magnifier icon![]() to launch the report editor (or launch Report Editor). Then, each object
to launch the report editor (or launch Report Editor). Then, each object ![]() stands for a chapter which can be added to your report.
stands for a chapter which can be added to your report.
Refer to Reporting to learn how to customize your report.