Slope Analysis
![]()
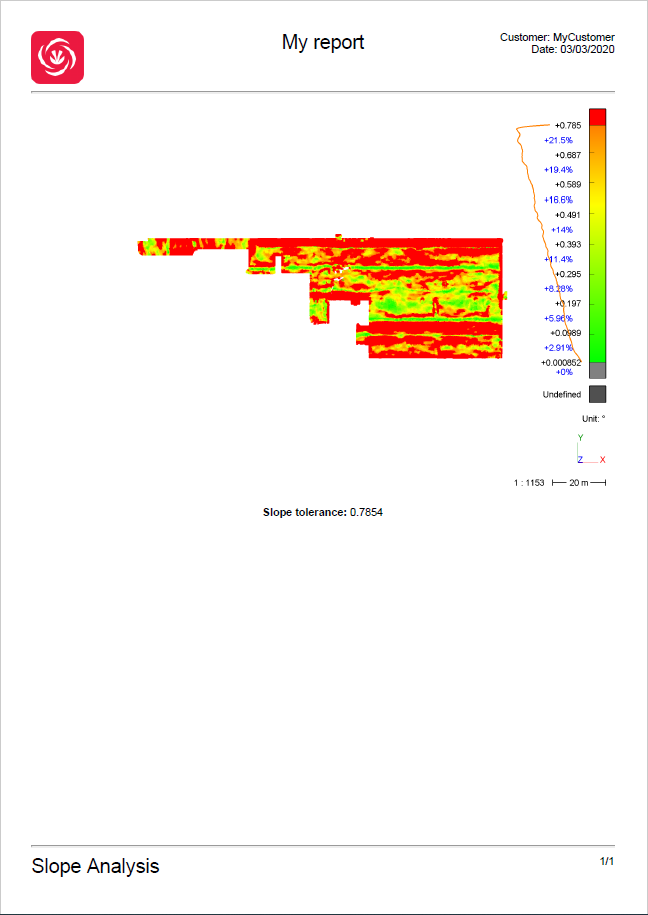
This command allows you to inspect the slopes of a mesh or a point cloud. An inspection value will be associated to each point of the cloud or vertex according to the angle between the local normal of the surface and the horizontal.
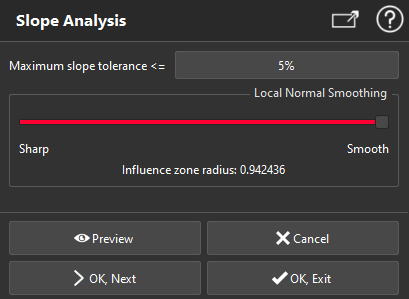
Select the mesh or the cloud on which you want to analyse the slopes and launch the command.
Note
You can also launch this command without selection, to analyze the levelness of planar parts of a cloud or a mesh. See paragraph "Compute the analysis on a planar area extracted from a mesh or a cloud" at the bottom of this page.
|
|
Note A default color map is proposed with 1 threshold: red for points outside the tolerance and a color gradient from green to orange for points inside the tolerance. |
Create a report
This command automatically creates reporting data ![]() in your document. This object stores your results so as to create a report later.
in your document. This object stores your results so as to create a report later.
From the treeview click on the magnifier icon![]() to launch the report editor (or launch Report Editor). Then, each object
to launch the report editor (or launch Report Editor). Then, each object ![]() stands for a chapter which can be added to your report.
stands for a chapter which can be added to your report.
Refer to Reporting to learn how to customize your report.
A report