Exercise: Create a complete report from a 3D inspection
Open the file BestFitOnRef.3dr.
Show only the inspected mesh Compare Theoritical Dam (good CS) / Aligned Dam 1 located in the Compare Inspect Group and make a Zoom All.
Create labels
First, launch the command Settings in order to customize labels aspect. Select the label size long. Then, click OK.
Now launch the command Measure Deviation.
Then select the option Point on Selection in the software's central toolbar and click some points on the color mapping. Click, for example, points with different colors (red, light blue, dark blue, green, yellow…).
As you can see in the label, there is a column with some "+" or "-" where the number of "+" or "-" tells you how far you are from the middle of the tolerance. A smile tells you that you are really in the middle of the tolerance. A "!" tells you that you are out of tolerance.
To add a comment, select the label(s) you want to comment and launch the command Edit Label and enter a comment in the corresponding field in the bottom of the dialog box. Then click OK to validate.
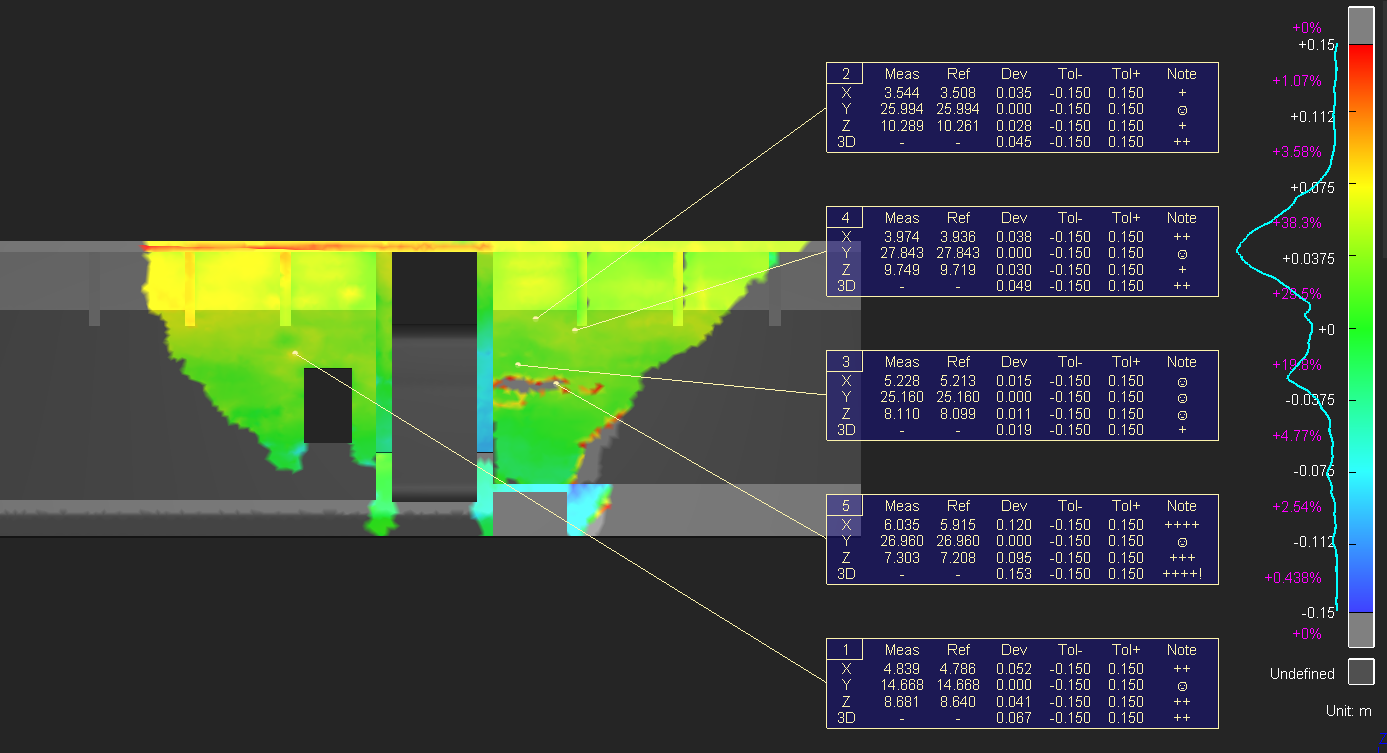 Labels created from the 3D inspection
If you click many points the function will automatically choose a smaller label size so everything fits in your screen.
Edit labels
Select the label(s) you want to edit and launch the command Edit Label. You will be able to change tolerance, comments, etc. You can also set which elements you want to show in the label thanks to the check boxes.
Create View Sets
If you want to add some views in the report, you have to create some view sets.
Show only the color mapping and one label and then go to View Set.
Now show all the labels, change the view and create a new view set.
Select the first view set in the tree explorer (in the Other Objects folder). Do a right-click and select Show. It will restore this view and you should see only one label. Now do the same with the second view set. All labels are visible now.
Customize and export a report
Once you have created labels and/or view sets, you can edit a report. Note the labels have been created into Compare Inspect folder.
Launch Report Editor or launch the editor thanks to the magnifying glass corresponding to the report data. The chapter Compare Inspect has been automatically generated with the Template Library Settings.
First, define the Layout Panel (paper format, margins, orientation, header, footer and number of decimals). For this exercise, remove the cover chapter. You can add or remove unnecessary cells (refer to Template View). Note that while inserting an item into a cell, the report editor will make you some suggestions. Otherwise, you can select this data from the Data Panel or write it by yourself. When you insert a picture, the image size and ratio are always respected. Consequently, if you want to reduce the image size, you have to reduce the cell width.
select the scene and set the mode on 3D to insert a 3D PDF in your report,
select the table and filter the columns: show only id, Meas X, Meas Y, Meas Z, Ref X, Ref Y, Ref Z, Dev 3D, Tol- 3D and Tol+ 3D. Align the table to center thanks to the Options panel,
optionally, insert another cell to display another scene (in 2D mode) using a view set previously defined, and
click the “To PDF" button to create and display a report in .pdf format. Then, you can print the document as usual.
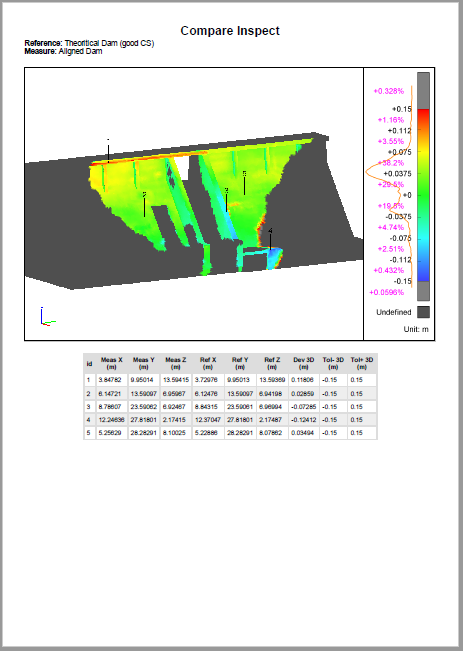 3D Inspection report with 3D PDF image