Exercise: Tunnel analysis
In the surveying field it is common to draw cross sections on a building, on a road or on a structure, in order to inspect it while it is being built or for periodic controls. The following commands have been developed taking into account the specific needs of tunnel inspection. They can of course be used for other applications, having similar needs.
Open the file
Open the file “CrossSections.3dr”. It contains the mesh of a tunnel that has been scanned and the theoretical mesh of the tunnel which has been created by extrusion of the theoretical section along the neutral axis. This file is going to be used through this whole exercise.
Create cross sections
First, we are going to create sections on the measured tunnel along the neutral axis. Select the mesh Measured tunnel and the polyline Neutral axis and go to Create Profiles along Axis.
You can see arrows appearing on the neutral axis to indicate its direction. It is possible to reverse it with the button Reverse Axis. Choose where to create the cross sections along the neutral axis. They can be created all over the axis with a regular step, or only on a certain part with a regular step, or at specific distances. First try the option All over with a regular step of 10 meters. The distances to enter are curvilinear distances along the axis: choose 3D (x, y, z) and locally perpendicular to the neutral axis.
 Create cross sections on a mesh along the neutral axis
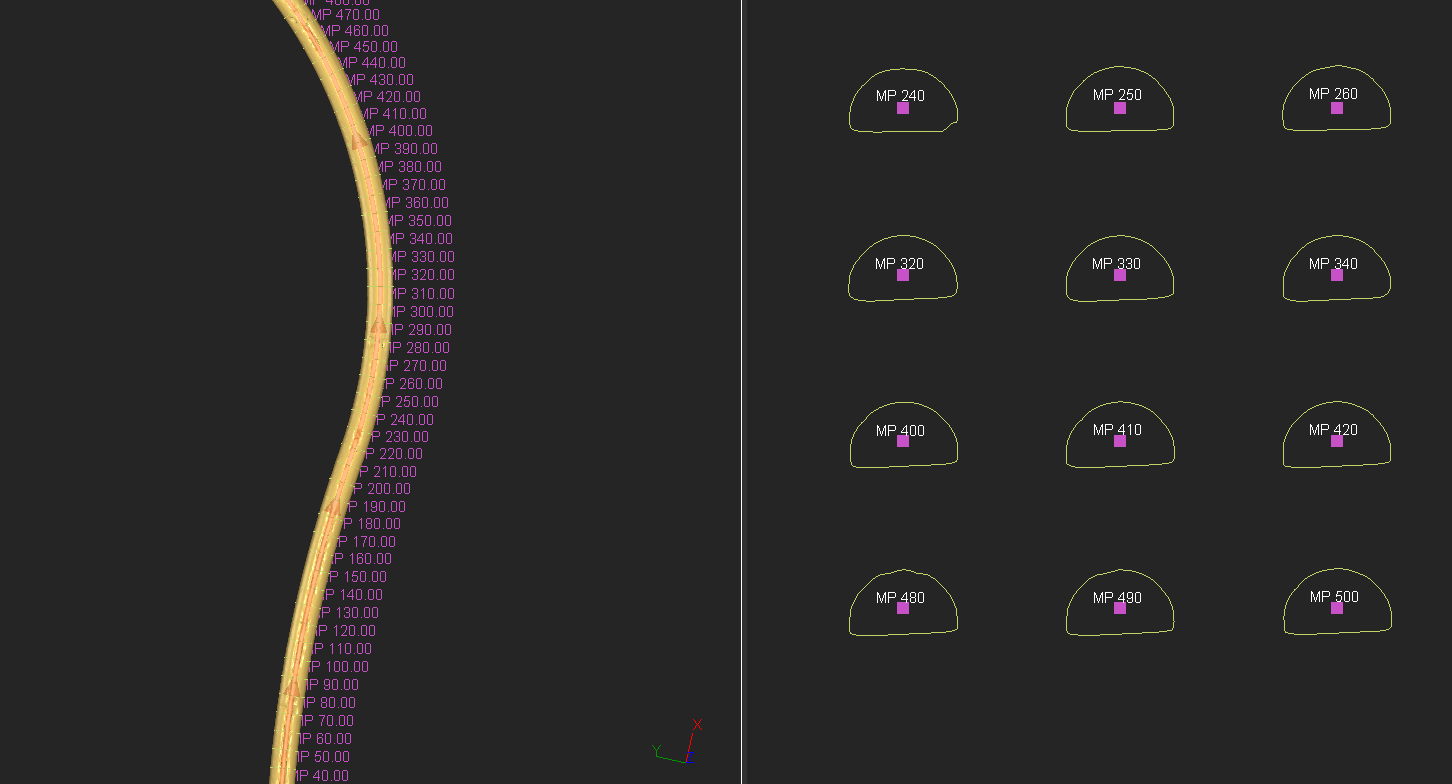
When you click on Preview, the created cross sections will be displayed in a 2D layout. You can choose to display them on a line, on a column, in a grid or individually. It is also possible to preview them in 3D with the button 3D. The scene is then split vertically in two views, with the 3D objects displayed on the left and the 2D sections previewed on the right.
The cross sections are displayed with their names composed of an optional prefix and their curvilinear distances on the axis. In this example we have MP as a prefix meaning “Milepost”. You can write your own prefix in the box Prefix.
From this dialog box it is possible to export the created sections in their 2D layout by clicking on 2D Preview / Export.
Click OK to validate the results. You can see a new folder named Cross sections: Measured tunnel. This folder contains all the sections created, named after the mesh they were created on, the prefix you chose and their distance on the axis.
Compare cross sections
Keep using the file “CrossSections.3dr”. We are going to compare cross sections from the measured tunnel with the theoretical tunnel.
Show only the neutral axis and both meshes (the measured tunnel and the theoretical tunnel). Select them and go to Create Profiles along Axis. This time, create sections From 100 to 210 in order to compare sections only on a specific part of the tunnel. Choose to create them at a regular step of 10 meters.
Click on Preview to compute the sections and then on Compare / Inspect to go directly to the command Compare / Inspect Profiles. You could also click first on OK to validate the result and then select the created folder containing all the sections and go to Compare / Inspect Profiles.
Set the inspection type: it is a tunnel (3D inspection). Choose which mesh is the reference, so here choose Theoretical tunnel. In advanced mode, several options are available to configure the comparison of the sections. It is possible to ignore deviations greater or smaller than a given value, deviations measured under a certain height to ignore points on the road of the tunnel. You can also measure deviations with a regular step along the section.
 Compare cross sections
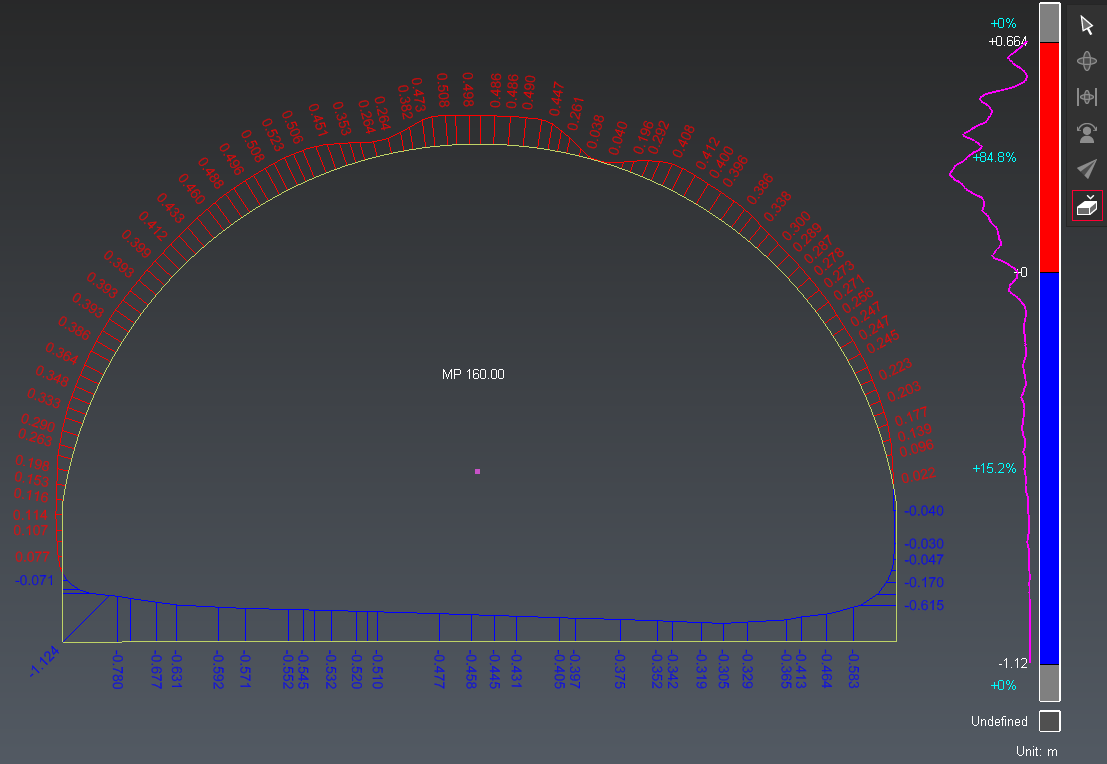
Deviations can be positive or negative, depending on whether the projected point is outside the reference section or inside. The colors of the deviations can be changed in order to distinguish overbreaks from underbreaks (see the picture above). It is possible to edit the colors or increase the size of the deviations by opening Edit color:
check the option Show Deviations diagram to display hairs,
check the option Show Quotations texts to display them in the 2D layout,
check Show Gradient to display the color scale in order to see the distribution of the deviations and the values corresponding to the colors, and
check the option Highlight Extreme Values to display a frame around the highest values of the deviations for each couple of sections.
As in the previous dialog box, you can choose the layout of the cross sections in their 2D preview, and the display of a 3D view.
Click OK to validate the results. The colored polylines resulting of the comparison are automatically added to the folder containing all the cross sections.
Preview and export cross sections in a 2D layout
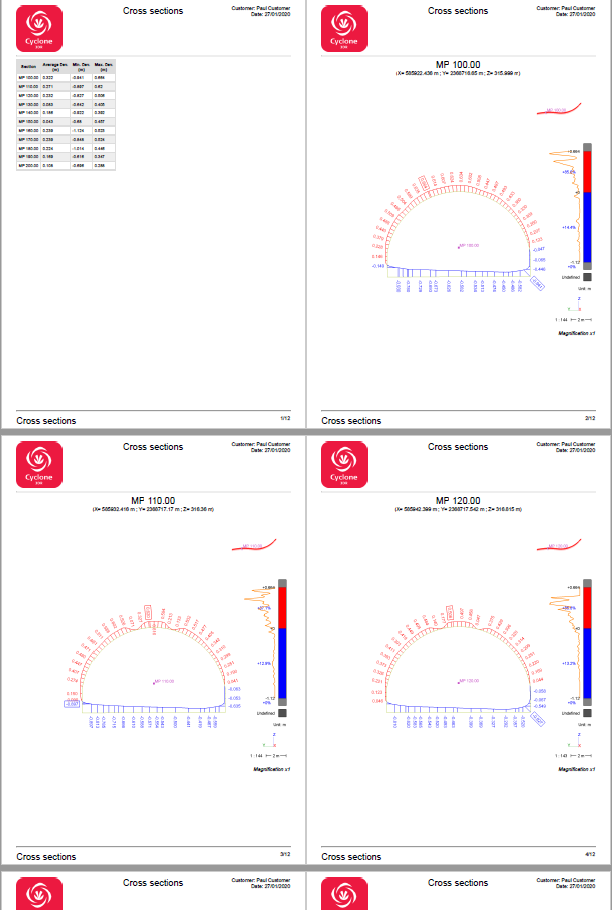
Select the folder containing all the cross sections, the intersection points and the compared polylines and go to 2D Preview/Export. This command is useful to preview at any time the cross sections in a 2D layout, and also to export them in this layout. The real coordinates of the intersection points between the neutral axis and the plane of the sections can also be displayed, as well as the colored polylines and the corresponding quotations texts.
Everything can be exported in one single DXF file or sent directly in AutoCAD.
Print cross sections in a dedicated template
Launch Report to open the report editor. You may have two chapters called Cross sections in the default report (because you have just created two cross sections folders in your project). Select one chapter: in the Template View, you can read the number of sections inside a dataset. Remove that containing 52 sections and the Cover chapter.
define the paper format and orientation in Layout panel: A4+Portrait. Reduce the number of decimals to apply to distances. Apply header and footer everywhere.
complete header and footer with logo, date, customer or company name, title, page number, etc. (refer to Template View). You can modify or create your own fields in Data panel,
edit the dataset, go to item n°10. Click on
 to unlink this item. Then, remove the side view and modify the main view (manual scale 1:500 and a 1/1 ratio). The ratio enables you to limit a scene height. Thus, you can put several objects in the same page,
Now click To PDF to create the pdf report corresponding to the defined template. Then, open the pdf and print it like any pdf document.
 Print cross sections in a dedicated template
Compute the volumes in overbreak and underbreak of a tunnel
Keep using the file “CrossSections.3dr”. We are going to compute the volumes in overbreak and underbreak between the measured tunnel and the theoretical tunnel on specific sections.
Select the theoretical mesh, the measured mesh, the axis and the folder containing the sections previously created, then go to Volume Over/Under.
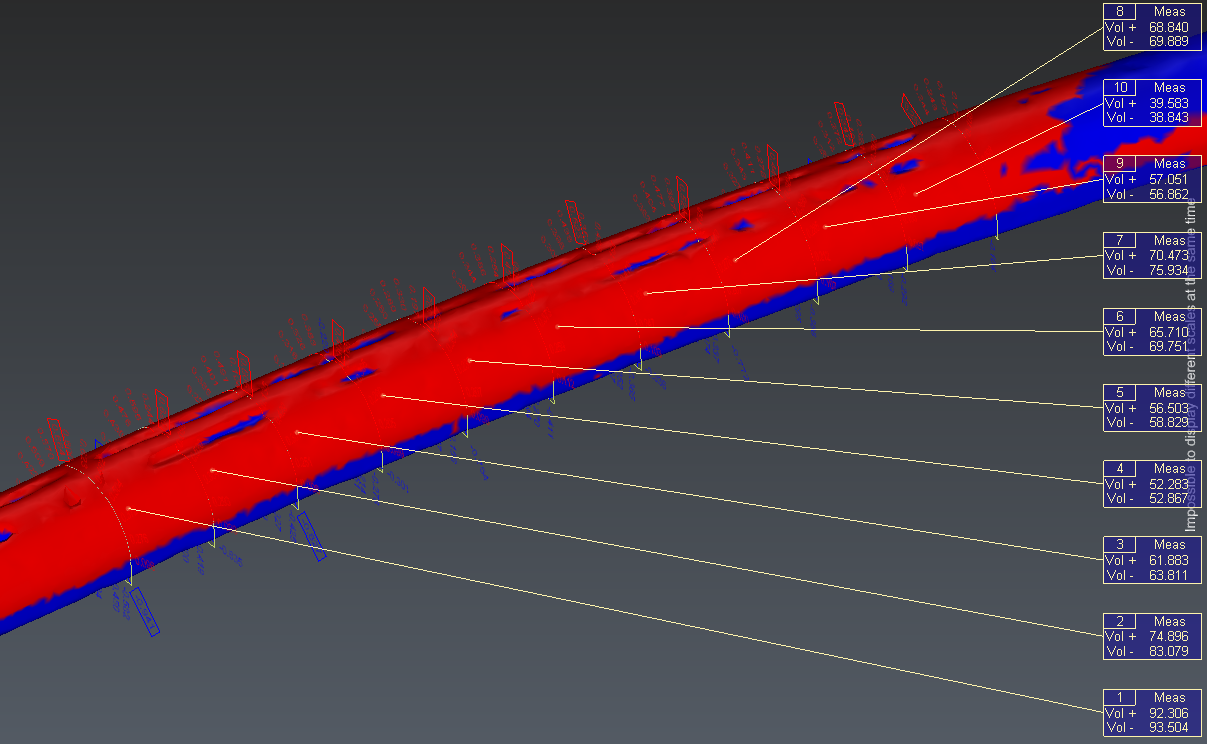
Choose which mesh is the reference. Here, select the Theoretical tunnel. Set the Step to 0.5m. Click on Preview to preview the results. The two meshes are entirely compared to display a 3D mesh colored with two colors: red for overbreak areas and blue for underbreak areas.
The volumes are computed for each part of the tunnels defined by two couples of cross sections. The method used to compute the volumes is the interpolation between cross sections. Subsections are computed between the couples of cross sections according to the Step value.
A label is tied to each part, showing the volumes of overbreak (Vol+) and underbreak (Vol-). The total volumes of all the parts are displayed in the dialog box. The labels are inserted in a new folder in the Measure Group. Detailed computation can be added to the report.
 Compute volumes of overbreak and underbreak