Using the CloudWorx module to inspect a bridge
Introduction
The CloudWorx module allows the user to open and use extremely large data sets in the form of Leica Cyclone or JetStream databases, and LGS files. The ability to open such large files without the exporting and importing steps saves time and increases productivity.
The same general workflow described in this exercise could be used with a Leica Cyclone or Leica JetStream database.
Exercise overview
In this exercise, we will learn to use the tools in the CloudWorx module by opening a LGS file and evaluate an area of a bridge to see how it has changed over time.
In this exercise we will:
learn to open and interact with a Leica Cyclone file,
use the tools in the CloudWorx module to create a local coordinate system and isolate the area in which we are interested,
compare an area of the bridge structure to a model and create reports.
The files used in this exercise are: BridgeData.lgs, and BridgeYear1-Deformed.stl
Explore the CloudWorx module
Launch Import LGS.
Choose BridgeData.lgs in your browser.
Select "Import LGS" in the Import Mode group.
Press Import to open it.
Notice that the treeview now contains a CloudWorx group.
The CloudWorx group contains the Cyclone point cloud. This cloud is handled by the CloudWorx module and allows you to open and interact with huge datasets that would normally not be possible to open and use in any modeling software package. Later on we will isolate the part of this cloud that we want to work with and convert it into a point cloud that we can use. Notice the colored circle next to the BridgeData.lgs object. If you press this you will be able to change the representation of the cloud from Real Color to Flat or Intensity as you like.
Isolate the area of interest and convert it to a standard cloud
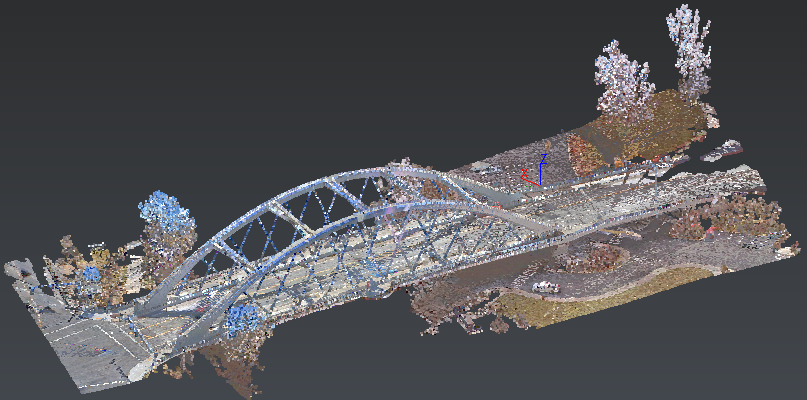
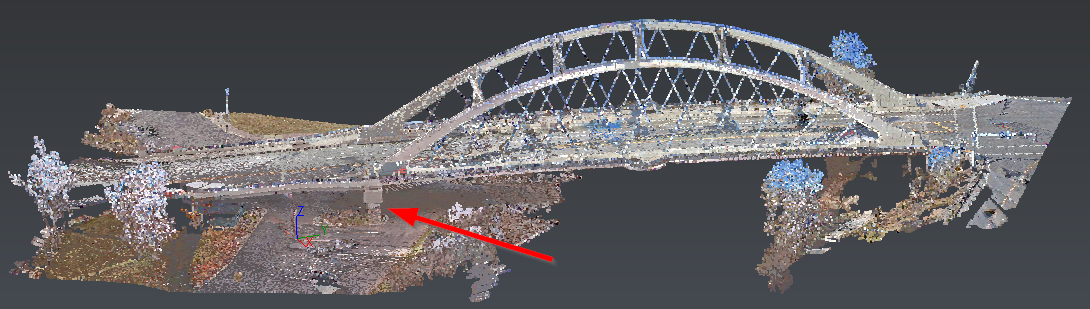 Fig.1: Area of interest, a pier
Create a Limit Box
Orient the view so that you have a good view of the area to be isolated. Optionnaly, you can create a UCS with 2 points (2 Points) so as to create directly a well-oriented box.
In the CloudWorx menu launch Create Limit Box.
You will click three points to define the box; the first two are the two corners of the box in the Z plane, and the third point defines the height of the box.
Don't worry about the shape of the box for now. In the next step we will go through how to change the limits of the box after it is defined.
Adjust the limit box as needed
In the Clipping Group, there should be a new item called Limit box
Click on the lightbulb icon next to Limit box to show it.
Select the limit box and launch Edit Limit Box
Rotate the box by clicking on corners and edges to make the box parallel to the pier. Adjust the size of the box by clicking on the faces of the box so that only the pier and the area around it are shown, as in the pictures below.
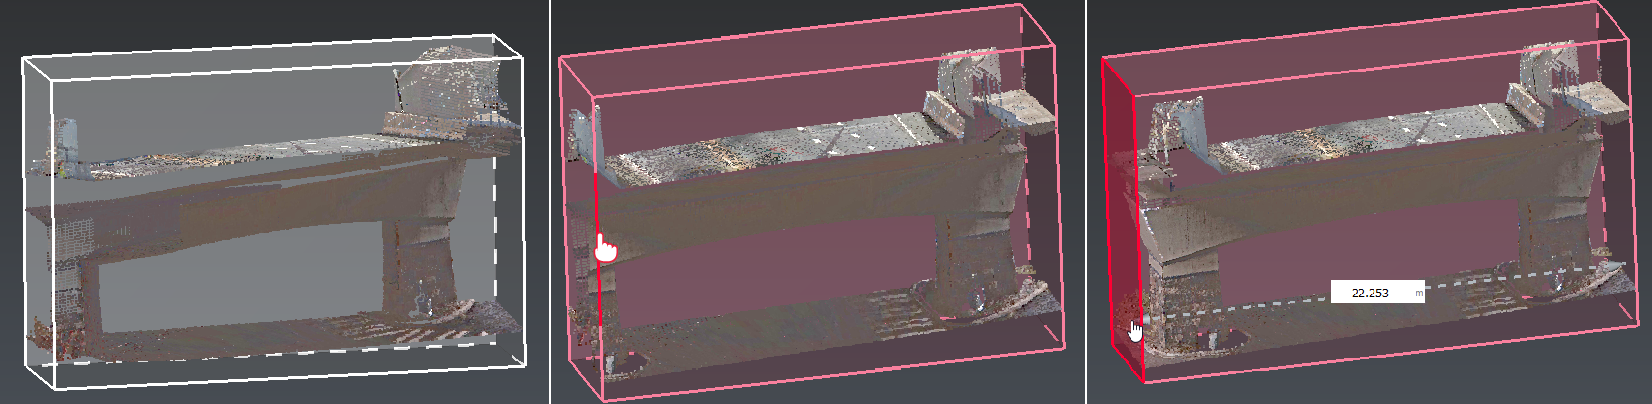 Fig.2: Clipping box adjustment
When you have the limit box in the correct size you can press CTRL+Spacebar to exit the Clipping Plane Mode.
You can Hide the limit box using the lightbulb icon next to the limit box item in the tree.
At this point we have the area that we are interested in isolated using the Limit Box. The next step is to convert the data that we have into a standard cloud so that we can use it to inspect the bridge support for wear.
Convert the CloudWorx cloud to a standard cloud
Launch Convert Project.
Enter a value of 10 million for the Maximum number of points value. The images won't be used later.
In this case it is really not necessary to limit the number of points in the converted cloud as the selection is relatively small, but in the case of a larger selection it may be required that you limit the size of the file to a reasonable level so that your PC does not run out of resources.
Close the CloudWorx connection
At this point we no longer need the Cloudworx cloud as we have taken the parts that we need and converted them to standard cloud.
If you wanted to save the current work as a CloudWorx project, now would be a good time to do it (Save). The cwproj file is fully compatible with other cloudworx plugins in order to share clipping objects, UCS...
On the CloudWorx menu, press Close.
Answer yes to the 'are you sure' message
Import the model of the bridge support
Launch Import and click on Add files.
Browse to the location where you have stored the sample files for this exercise and open BridgeYear1-Deformed.stl file.
Click on Import.
Compare the model that was created one year ago to the scan of the present day support
In the tree view expand the CloudWorx and Mesh groups
Select the mesh BridgeYear1-Deformed first
Select the cloud named BridgeData
The order of selection is important when doing Compare/Inspect operations. The first item selected is treated as the nominal, or 'object to compare to'. The second object selected is compared to the first.
Launch Cloud vs Mesh.
In Apply colors on, choose to apply on Reference (BridgeYear1Deformed)
Uncheck Force projection direction as we will want to compare the cloud using the mesh normal to calculate deviation.
Check Max distance and set to 0.25.
Check Keep only relevant points.
Press Preview.
When the computation completes press the Edit Colors button to change the colormap to show the areas of deviation that we are interested in.
Adjust the upper an lower limits to about +0.05 and -0.05. The finished inspection should look as you see below.
Press OK on both dialogs to finish
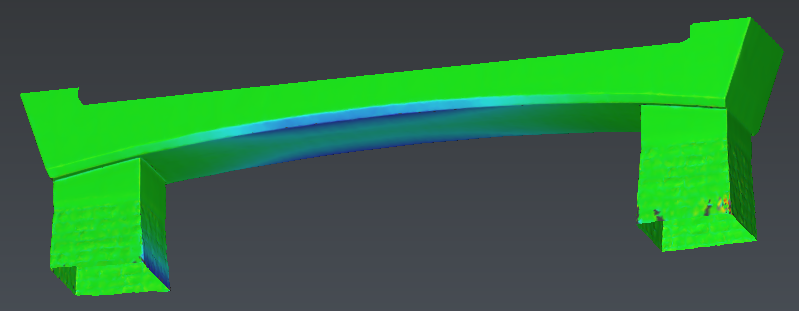 Fig.3: Inspected mesh
Create cross sections
Activate the WCS.
Select the inspected mesh in Compare Inspect folder.
Launch Planar Sections.
Define Axis direction: x = -0.95 y = 0.32 z = -0.01
Choose Regular with parameters below:
Step: 1m
Range: Custom
From: x = -8.4 y = 17.3 z = 2.1
To: x = -21.5 y = 20 z = 2.5
Check Create inspected section. Increase the magnifying. For instance, choose a 10 factor.
Choose to create only the sections, then Click on OK, Exit.
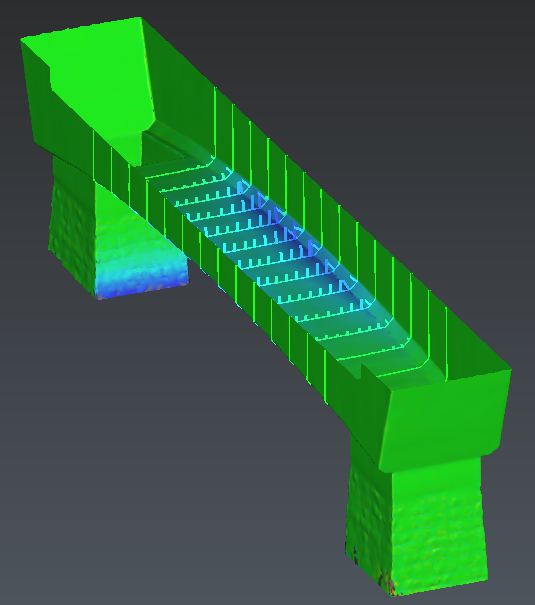 Fig.4: inspected sections
These sections can be sent to AutoCAD (or bricsCAD):
Open AutoCAD,
Select the sections,
Open the contextual menu,
Choose AutoCAD.
Then, with cloudworx for Autocad, you can load the .cwprj.
Create some labels to show the deviation values
Launch Measure Deviation.
Click on the inspected mesh in the area where the wear is (blue) to create some labels
You can change label aspect in Label settings:
Change the Label type to small if it not already set.
Experiment with the label colors, transparency, number of decimals etc. to become familiar with what is possible.
Create viewsets to have some screen captures in our report
Orient the view so that you are looking down on the project by pressing Z on the keyboard to snap the view to looking down
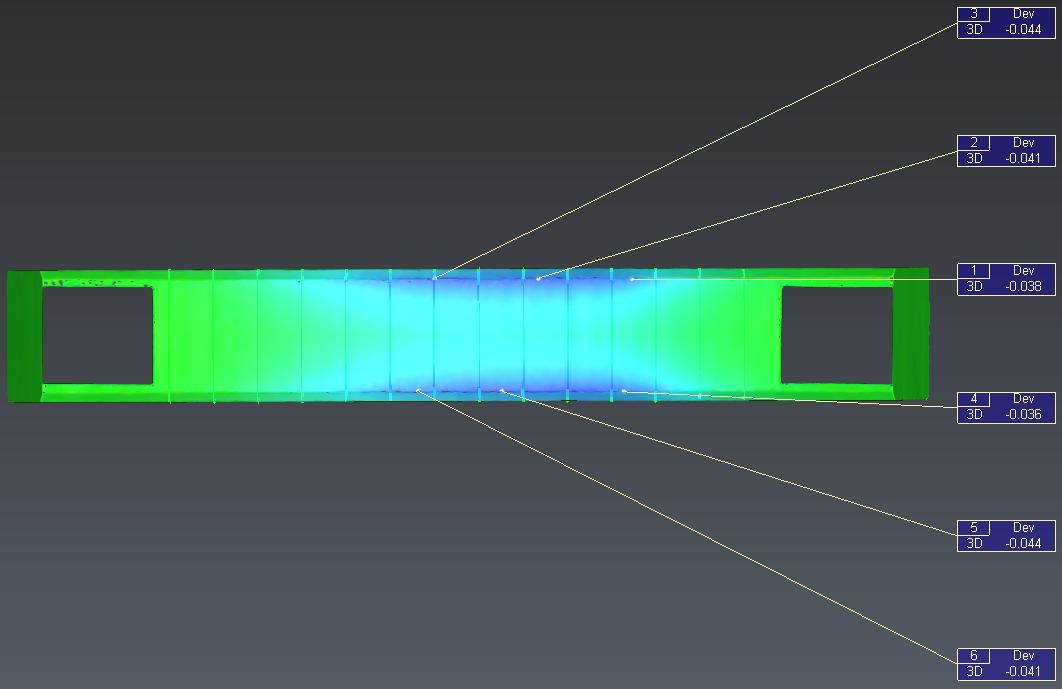 Fig.5: Top view with labels
Launch View Set.
Name this view Top.
Reorient the view to have a look at the bottom from the perspective of someone standing nearby
Create another viewset named Ground
You may want to change the transparency of the inspected bridge to make it easier to see your labels or leader lines. Try to change the transparency by using transparency control next to the inspected mesh in the tree or by selecting the item in the 3D scene and right clicking and selecting Transparency
Create the label report
In the ribbon menu, open Report menu.
Remove the chapter called Cover and select the Compare Inspect one. This chapter has been initialized thanks to a default template.
Select the scene and set it on 3D mode in order to insert a 3D PDF.
Select the table. Remove unnecessary columns and align to center the table.
Add two cells below, drag and drop Ground and Top viewsets.
Press To PDF and Open the report.
When your report opens up it will probably be shown as a black screen with a warning on it that 3D content has been disabled. You will need to press the Options button and either select Trust this document this time only or Trust this document always
Handle a 3DPDF
At the top of the 3D scene of the report press the Toggle Model Tree icon
 next to the Views box
Notice that the items from your project can be toggled on or off as you like
Close the model tree view
To the left of the Views box press the Rotate icon

Insert a comment
Take a measurement
Experiment with the Section Cut tools

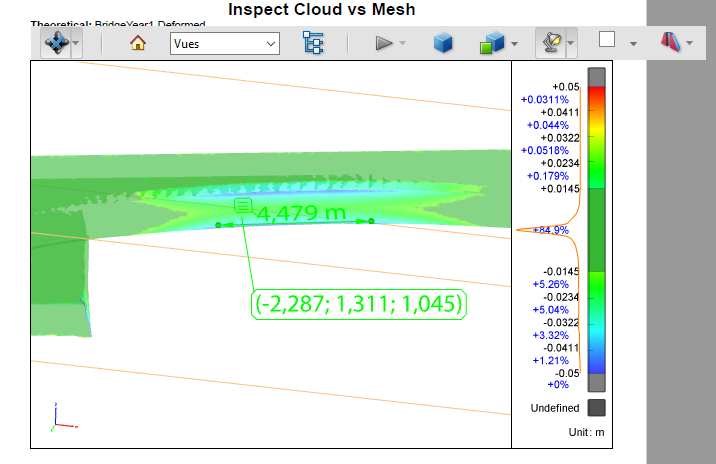 Fig.6: 3DPDF